
|
Who's There? Firewall Advisor User's Guide Main Window |
 |
|
|
Who's There? Firewall Advisor User's Guide Main Window |
|
This chapter assumes that you are familiar with the material presented in Basic Concepts. This chapter describes the main window, shown in Figure 1 below. This window gives an overview of the data in the firewall's log file, and is always present while Who's There? is running.
The major components of the main window are:
Each component is discussed in its own section below. You can also search and export the currently-displayed data.
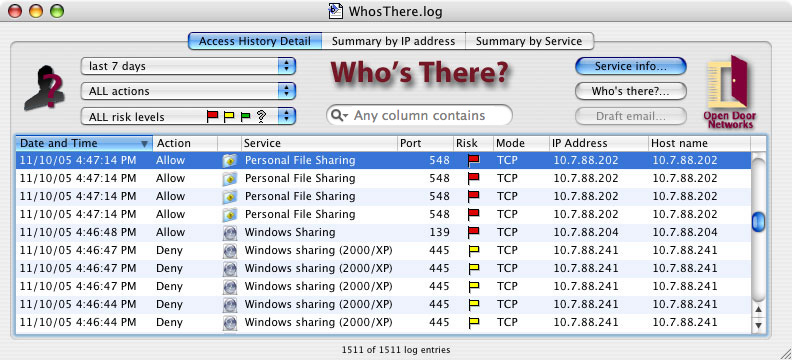
Figure 1. Who's There? main window, Access History Detail
You can control which firewall log lines are processed, using the popup menus in the upper left of the main window and, in the Access History window, the filter field in the center. See Figure 2 below.
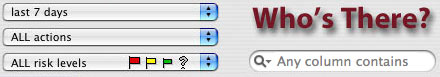
Figure 2. View selection popup menus and filter field
The log lines to be processed can be specified:
The risk level assigned to a particular service is based solely on the particular service, and doesn't take into account other risk-related factors, such as those discussed in Investigating Accesses. Note that rating a service as high risk does not mean the service is inherently risky, only that a breach of security to that service could have serious results for the user. Stated risk levels represent Open Door's best analysis, but cannot be guaranteed to be correct. The risk levels selected with the risk level data filter are indicated in the risk levels popup menu by one or more risk icons.
![]()
high
![]()
medium
![]()
low
![]()
unknown
Table 1. Risk rating icons
Changing filter settings can change the number of log lines that Who's There? displays. The actual number of lines displayed is indicated at the bottom of the main window, along with the total number of lines in the log file.
The popup menus match the three most commonly used filter columns. In the Access History window, you can additionally filter on any other single data column, or all data columns, using the filter field in the center of the window. By default, the field will look for the data you enter there in all columns, and only display lines that include what you've entered. You can also use the magnifying glass icon at the left side of the filter field to select a specific column to search for matches in. Different columns match the data you enter in the filter field differently, as indicated when you click on the magnifying glass. For instance, the port number column requires an exact match, whereas the host name column just needs to match any part of the data you enter. Columns not currently displayed can even be matched against, although you of course won't be able to see the actual matching data in the lines displayed.
Unlike the popup menus, the filter field only appears in the Access History window. It is not available there when status information is being displayed, which will usually only happen when you first run Who's There?
Using the tabs across the top of the main window, the way in which the data is viewed can be changed:
![]()
Figure 3. Tabs controlling the data view
Each type of view is covered in the following sections.
This is the view shown in Figure 1 above. In this view, lines from the log file are simply displayed, without summary. Each line usually corresponds to one attempt to access a service on the firewall machine, but can correspond to more than one such attempt if Don't show duplicates is checked. Only the lines selected by the data filter popups and filter field are displayed. The default columns are:
There are four other columns that can be displayed:
We should clarify a few of the above columns. When a user on another machine tries to access a service on your machine, they send one or more packets from their machine to yours. The IP address of their machine is the source IP address (column IP address) and the port from which they send the packets is the source port (column Src Port). The IP address of your machine is the destination IP address (column Dst IP Address) and the port to which they send the packets is the destination port (column Port), representing the service (column Service) which they are trying to access. Normally, out of these five columns, only three are of concern: IP address (who is trying to access your machine?), Port (what port are they trying to access?) and Service (what's the name of the service associated with the port). For example, say someone on a machine with an IP address of 10.0.0.27 tries to contact Personal File Sharing on your machine, which has an IP address of 192.168.1.222. The column values would read as follows:
Columns can be resized by dragging the right edge of a column header, and moved by dragging the column header. If you wish to omit certain columns, or add others, see Display Preferences.
There are two menu commands associated only with the Access history detail:
Sorting is controlled as described in the section on sorting.
This view, shown below in Figure 4, groups the data in the upper pane by service. Only log lines selected by the data filter popups are included in the totals. The lower pane displays summary information about each of the IP addresses that attempted to access a service selected in the upper pane.
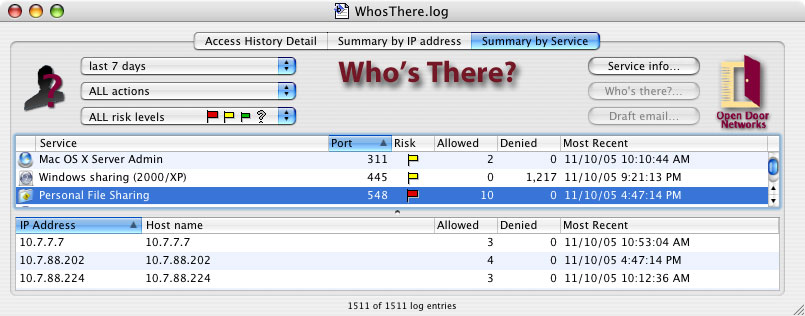
Figure 4. Main window, summary by service
The columns in the upper pane are:
The columns in the lower pane are:
The horizontal divider between the upper and low panes can be moved by dragging the dot in the center of the bar. For example, in Figure 4 Windows Sharing is selected. The upper pane shows that there were no allowed attempts and 4 denied. In the lower pane, for each address from which access was attempted to Windows Sharing, we see a summary of allowed and denied attempts, and the most recent attempt. Sorting is controlled as described in the section on sorting. Columns in either pane can be resized by dragging the right edge of a column header, and moved by dragging the column header.
This view, shown below in Figure 5, groups the data in the upper pane by IP address. Only log lines selected by the data filter popups are included in the totals. The lower pane displays summary information about each of the services to which access was attempted from the IP address selected in the upper pane.
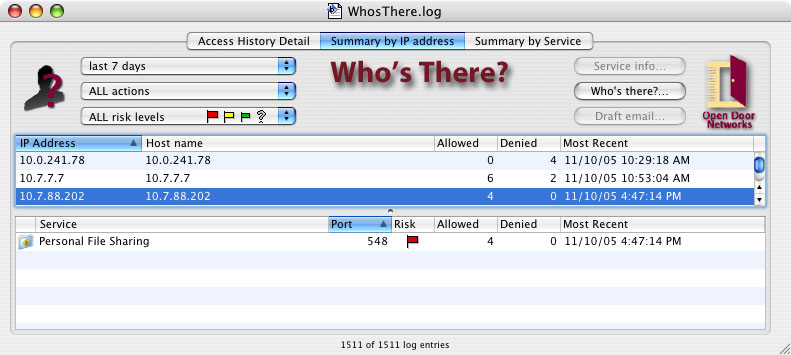
Figure 5. Main window, summary by IP address
The upper pane displays summary information about accessing IP addresses. The columns are:
The lower pane displays information about services to which access was attempted by the IP address selected in the upper pane. The columns are:
The horizontal divider between the upper and low panes can be moved by dragging the dot in the center of the bar. For example, in Figure 5 the IP address 192.168.1.7 is selected. The upper pane shows that there were no allowed attempts and 2 denied. In the lower pane, for each service to which access was attempted from 192.168.1.7, we see a summary of allowed and denied attempts, and the most recent attempt. Sorting is controlled as described in the section below on sorting. Columns in either pane can be resized by dragging the right edge of a column header, and moved by dragging the column header.
Sort columns used in the upper and lower panes are independent. To sort by a given column, click on the column's heading. The current sort column is indicated by a blue heading. In Figure 5 above, the upper pane is sorted by IP address, and the lower pane by Port.
The sort sense (ascending or descending) is specified by the sort triangle at the right edge of the selected column heading. Who's There? applies the same meaning to the sort triangle as does the Finder. That is, ascending order is used when the triangle points up, descending when the triangle points down. The default sort order for each column is that which is most likely to be useful. Thus, the default sort order for accesses denied (and allowed) is descending, but for host names is ascending. The sort sense is toggled by clicking the sort triangle.
The action buttons are located in the upper right of the main window.

Figure 6. Action buttons
Note that each button will be active only if it makes sense for the selected item in the main window. For example, in Figure 4 only the Service info button is enabled, since the active selection is that of a service. Likewise, in Figure 5, the Service info button is not enabled, since the active selection is that of an IP address.
For details of the Who's There? dialog, please see Who's There? Dialog.
You can search the data displayed in any of the three views of the main window for a specific string. Choose Find from the Edit menu (or hit command-F), and specify a string to search for. Who's There? will start searching from the line after the previously selected one for the string you specify. It will highlight the next line it finds that contains, in any column, the string you specify. The string does not have to completely match a column entry, but simply be part of an entry to match. After matching, you can use the "Find Next" and "Find Previous" commands within the Find menu item to search for the same string again in other lines.
There are a couple items to keep in mind when searching. First, Who's There? will not match the search string against certain columns, in particular any date/time columns and the Allowed/Denied columns in the Summary by IP address and Summary by Service windows. Second, in those two windows, Who's There? will only search the currently active field (which is indicated by a highlighted border) for the specified string. You can move between the two fields either by clicking within the desired field or by tabbing between them.
You can export to a text file the information displayed in any of the three views of the main window. Choose Export from the File menu, and specify a file name and location. Only the data actually displayed will be exported.
Extra information on services
Beyond what's in the Service Info pane of the Who's There? dialog, additional information on most services is available in Internet Security for Your Macintosh and iPhone and its associated blog, Twitter stream and "Top 10" list. If you select a service in any of the following three ways:
you can then request further information on the service by choosing "View eBook" from the Book menu, or typing Cmd-E. You can also click the eBook button in the Service Info dialog. Who's There? will display additional information on the service, if any, in your default browser. See Figure 7.
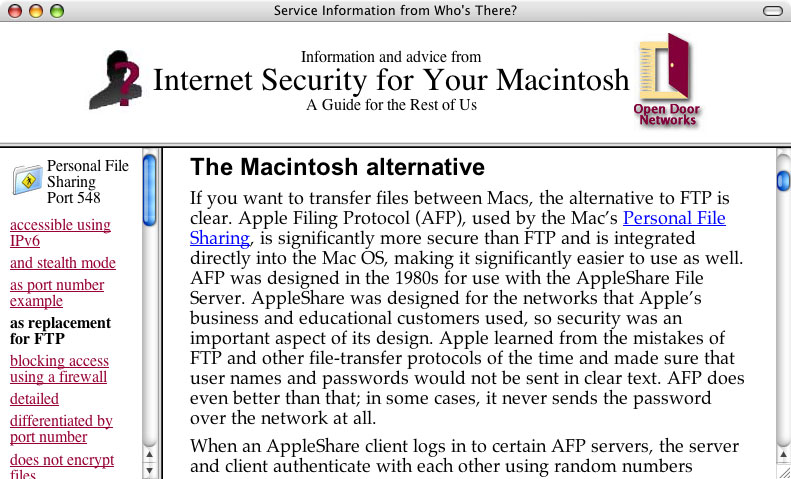
Figure 7. eBook entries on port 548
A list of relevant passages is displayed on the left, with the text of passages displayed on the right. If there is nothing in the book that corresponds to a service, you'll see a list of passages that relate to unknown services. You can also search the book's blog, isfym.com, and Top 10 list for current information on the service; or visit our Twitter stream (twitter.com/isfym) for even more up-to-date information.
![]() Back to Table of Contents
Back to Table of Contents
![]() Back to Getting Started
Back to Getting Started
![]() Forward to Who's There? Dialog
Forward to Who's There? Dialog